


US CPI inflation in July: A former central banker’s view
2024-12

Photo by the Federal Reserve Board
The US CPI data for July were released yesterday. I had not planned to comment on them, but they are interesting so here come some quick thoughts.
While some commentators often focus on very specific sub-components such as used cars, central bankers tend to look at the big picture. They know that one can decompose inflation in hundreds, if not thousands, of different ways. But for every component that was unexpectedly weak, one can often find one that was unexpectedly strong (and vice versa). Thus, looking at sub-components is often less helpful than one might think.
Here I look at four components:
Headline inflation, because that is what the public worries about.
Core inflation, because central bankers think it is more useful for analysing inflation.
Core inflation ex shelter, since that component has been unusually strong in recent months and is subject to long lags, making core inflation difficult to interpret.
Shelter.
The table below shows annual and monthly inflation computed using the seasonally adjusted data. Two aspects are interesting:
While annual headline and core inflation are both around 3% and thus still too high, that is because of the shelter component. Core inflation ex shelter is running below 2%.
While annual inflation – which is best thought of as an average of inflation over the last 12 months – is still high, monthly inflation is around the 0.17% level that is associated with 2% annual inflation. The shelter component is much higher than so, but core inflation ex shelter is effectively zero.
Since I think the shelter component is declining as current rental contracts are increasingly reflected in it, it seems to me that the US has returned to price stability.

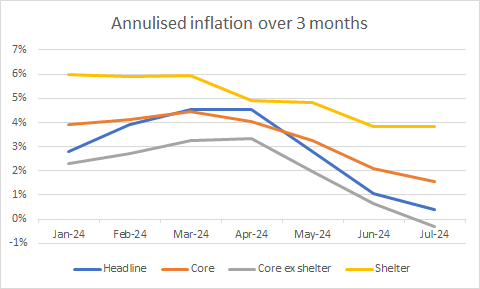
A better way to see that is to plot the annual and annualised 3-month inflation rates computed using these components.1

Source: SA data from BLS
Source: SA data from BLS
While the annual inflation rates show a gradual decline in inflation, the annualised 3-month inflation rates show an abrupt decline in price pressures since May.
I think the FOMC will cut interest rates in September by 0.25% in response to these data and continue cutting as the autumn progresses. Unless the incoming data between now and the September meeting worsen significantly, I don’t think it will cut by 0.50% since that could be seen as signalling a crisis. But I could be wrong — let’s see what happens on 18 September.
The work reported here is preliminary and may be subject to errors. It should not be seen as constituting investment advice. Readers are advised to seek professional investment advice.
To be clear, the annualised 3-month inflation rate is computed as 4*(p(t)/p(t-3)-1).