
The Effective Tariff Rate in the US Since 1929
Tariffs are high but their impact on inflation is hard to detect


Punchline: Dividing customs revenues by imports gives a simple measure of the effective tariff rate, which spiked in the Depression, fell with postwar liberalisation, and has now climbed under the Trump administrations to its highest since the 1930s. Estimating inflation equations since 1959, I find no evidence that this measure drives US inflation, likely because the CPI is volatile and earlier tariff changes were modest. Yet given the scale of recent increases, it is hard to believe they have no effect, leaving the puzzle of why the evidence is so elusive.
The muted response of US inflation to the Trump administration’s tariffs remains an enigma.
There are several possible explanations. US sellers may initially draw on inventories imported before tariffs were imposed. They may also delay raising prices until competitors do so, or until it becomes unavoidable.
Another possibility is that demand for tariffed goods falls sharply. This would mute the impact on prices but magnify the fall in import volumes and foreign sales.
The effective tariff rate
One way to explore this is to divide customs revenues by the value of imports. This “effective tariff rate” is not the same as the statutory rates in the tariff schedules. It shows what US importers actually paid in tariffs. It also avoids the need to sift through thousands of tariff lines. Because it reflects both policy decisions and the composition of imports, it is a useful measure of how tariffs affect trade and prices.
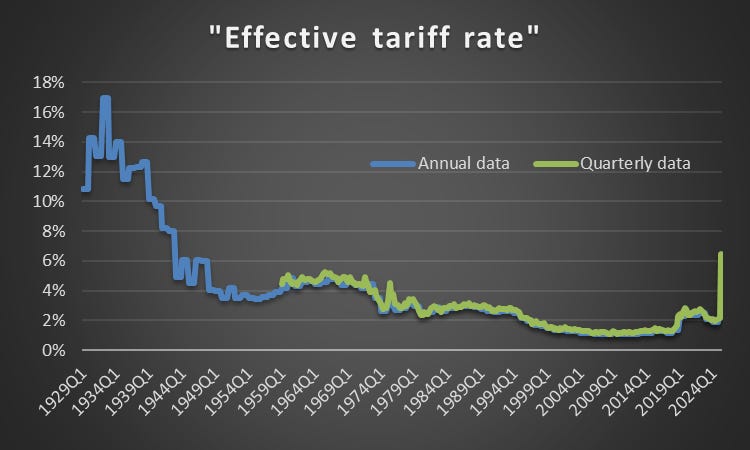
Sources: My calculations on data from FRED and the Congressional Research Service
Using annual data, the series can be calculated back to 1929. Using quarterly data, it can be computed from 1959.
While tariffs were the federal government’s main source of revenue in the nineteenth century, that was no longer the case by 1929. Income taxes had taken over as the main source of federal revenue. In the modern era, tariffs were about protection, not funding the state. That helps explain why the effective rate could fall so sharply without creating fiscal strains.
The series begins dramatically. In 1930, Congress passed the Smoot–Hawley tariff, raising duties on a wide range of goods. At the same time, the Great Depression caused imports to collapse. With revenues falling by 46% between 1929 and 1932 while imports fell by 65%, the effective tariff rate shot upward. It rose far more than statutory rates alone would suggest. The lesson is that the ratio is shaped by both posted rates and economic conditions.
The decades after the Second World War look very different. The United States led global trade negotiations under the GATT that steadily reduced tariff barriers. My calculations suggest that the effective tariff rate fell from 6% in the late 1940s to 2% in the 1970s. This was part of building a postwar order in which open markets supported growth at home and abroad, with the US playing a leading role.
From an average of 3.4% in the 1970s, the series fell to an average of 1.3% in the 2010s. In this period, trade policy shifted toward non-tariff barriers. Quotas, voluntary export restraints—such as those imposed on Japanese cars in the 1980s—anti-dumping duties, and complex technical standards became important elements of trade policy. Looking only at the effective tariff rate therefore understates the degree of protection in these decades.
The final chapter comes with the Trump administration. Beginning in 2018, tariffs on steel, aluminium, and a wide range of Chinese products were raised. Customs revenue increased, and the effective tariff rate rose with it, from 1.3% in 2018Q1 to 6.5% in 2025Q2. This is the highest effective rate since the 1930s, though still well below Depression-era peaks. A further increase is likely when the data for 2025Q3 are published.
The effective tariff rate since 1929 thus tells a clear story. A spike in the Depression. Steady liberalisation in the postwar decades. A shift toward non-tariff barriers from the 1970s. And a sharp tariff revival under Trump.
Tariffs and inflation
Back to tariffs and inflation. Using the quarterly data that start in 1959, I estimate several inflation equations but do not find evidence that changes in the effective tariff rate fuel CPI inflation.
That may not be surprising. The CPI fluctuates for many reasons, and it covers a wide range of goods and services that tariffs do not touch. With so much noise in the aggregate data, the effect of tariffs may simply be too small to detect, especially since changes in the past were generally modest.
A more promising approach might be to look at subsets of prices more directly exposed to tariffs, or to control carefully for other drivers of inflation such as labour market conditions, oil prices, or imports not subject to tariffs. That may make it possible to identify an effect.
Even so, it is difficult to believe that the recent wave of tariffs will leave no mark. The measures introduced by the Trump administration are unusually large and wide-ranging. As the Richmond Fed has argued, there are reasons to think that the pass-through has been delayed.
For now, the puzzle is not whether tariffs raise prices, but why the evidence is so hard to pin down.
Currency offset to the tariffs could also be a factor. Try using pre and post Bretton Woods samples.
Good piece. But I do think the impact is expected to be relatively modest given imports are relatively small in the US. I wrote about the Fed paper by Minton and Somale - by April, the impact on inflation was a 0.1% higher PCE over the 2 months. The pass-through has been so far smaller than before, but it might come in during the summer/fall.
My take on the Minton-Somale paper - https://www.nominalnews.com/p/yes-tariffs-have-increased-prices
Minton-Somale Paper- https://www.federalreserve.gov/econres/notes/feds-notes/detecting-tariff-effects-on-consumer-prices-in-real-time-20250509.html