

Monthly Swiss inflation forecasts
2024-04


As I noted earlier, in my first posts I will look at the Swiss economy from a quantitative perspective using a few back-of-the envelope calculations. My intention is to use these tools again in the future to as new data are published.
In my first post I compared the SNB’s inflation forecasts with those from a simple autoregressive (AR) model and found that they were not widely different. Indeed, I found that the RMSE of the AR forecasts were trivially lower than the RMSE of SNB forecasts. That is not too surprising: it is well know that it is difficult to beat forecasts from simple time series models.
Of course, such models can not be used to simulate the effects of alternative policies so are of limited use for central banks. But for observers of monetary policy, they can be helpful. By comparing how actual inflation evolves relative to past forecasts, one can get a sense of whether inflation pressures have changed.
Adjusting the model
Before looking at the forecasts, I make two adjustments to the AR model that I used earlier.
First, it appears that only the “quarterly lags” are significant, so the right-hand side variables are monthly inflation three, six, nine and twelve months ago. While this is a very simple model, it can still be useful for understanding what is happening in the Swiss economy.
Second, long run forecasts from AR models always equal to the in-sample mean of the variable forecasted. Over the period 2001-2019, inflation in Switzerland and in many other economies was very low – in Switzerland it averaged 0.4%. Since the SNB defines price stability as inflation of 0-2%, one would expect inflation to average 1% as it did almost exactly over the period 2000-2008.
Since there is little reason to expect inflation in the future to average 0.4% and some reason to expect that it will average 1%, I estimate a version of the AR model that imposes that constraint.
The forecasts
I first present the unrestricted forecasts and the restricted forecasts.

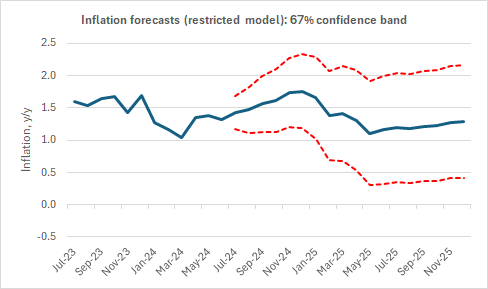
Source: my forecasts as described in the text.
Comments
Inspection of these graphs show that the while the time path of the two forecasts are very similar, the restricted forecast runs a little above the unrestricted forecast (as it is forced to reach a steady state of 1% for very long forecasting horizons).
The forecasts both suggest that inflation will rise trivially in the second half of 2024, before falling in 2025. Interestingly, the inflation rates are in December 2026 in both cases above their long run steady-state level.
The confidence bands are wide, because Swiss inflation has historically been volatile. Forecast of more than a few months should therefore be taken with a grain of salt.
In the appendix I tabulate the monthly forecasts together with quarterly averages, together with the forecasts released by the SNB following its June 2024 Monetary Policy Assessment. They behave similarly to my simple AR forecasts and lie between the unrestricted and restricted forecasts.
It will be interesting to see how future inflation rates behave relative to these forecasts. Thus, I plan to return to them in the coming months.
I would be keen to hear your comments and reactions.
Appendix
Below please find the monthly forecasts and the associated quarterly averages, together with SNB’s June 2024 quarterly forecasts.

Source: my forecasts as described in the text and SNB’s press release after the June 2024 Monetary Policy Assessment.