


In this post I return to the question of the extent to which US inflation was primarily driven by aggregate supply or demand factors in recent years. Several authors have recently studied the important of supply and demand factors as a driver of inflation since the start of covid in 2020, including by Forbes, Ha and Kose and Shapiro.
To study the role of aggregate supply and demand shocks, they must be identified. Here I use a novel but simple approach that focuses on how these shocks impact on inflation and real GDP growth.
A key lesson in a first economics course is that while demand shocks move price and quantity in the same direction, supply shocks move them in opposite directions. A particularly interesting case is that in which the price elasticity of the demand curve is (minus) unity. In that case, supply shocks move price and quantity in opposite direction but leave price times quantity unaffected.
The macroeconomics of this is a situation in which nominal GDP growth is determined by aggregate demand, while aggregate supply factors determine how nominal GDP growth is divided between inflation and real growth.
Below, I use this assumption to discriminate between aggregate supply and demand shocks in the US and look at their relative importance in driving real GDP growth and inflation since the start of covid in early 2020.
The data
I start by looking at four-quarter real GDP growth and inflation (as measured by the GDP deflator) since 2000. The graph below shows there have been three episodes of macroeconomic weakness and that these were of increasing severity.
After the bursting of the dot.com bubble in the early 2000s, when real GDP growth fell to zero, a second collapse occurred because of the Global Financial Crisis that was triggered by the failure of Lehman Brothers in September 2008. This downturn was severe, with real GDP growth falling to almost -4%. The third collapse, caused by the onset of the covid pandemic, was much deeper as real GDP growth fell to -8% in 2020Q2.

Source: FRED
Interestingly, the first two episodes caused inflation to fall, suggesting that aggregate demand was weak. The third episode, the covid pandemic, led with a delay to a surge in inflation, which reached 7% in the second half of 2022, before falling to about 2.5% in 2020Q2. This is a more complicated pattern which points to role for both aggregate supply and demand factors.
Aggregate supply versus demand shocks
Next I estimate a VAR(4) model for the annualised quarterly growth rate of real GDP and inflation over the period 2000Q1 to 2024Q2. I proceed to identify the two aggregate shocks using the assumption that the price elasticity of aggregate demand is -1 as discussed above.
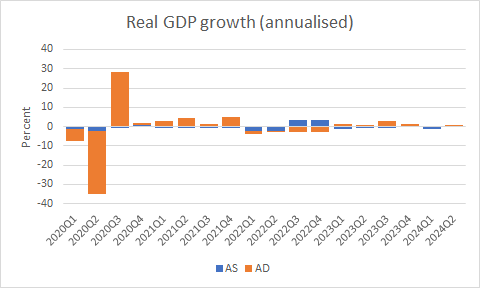
The graph below shows the estimates of the shocks. By construction, the shocks are serially uncorrelated, have zero mean and unit standard deviation in the full sample (but it may of course be smaller or larger in any subsample). A positive aggregate supply shock is defined as one that raises economic growth and lowers inflation.
Strikingly, the first 10 aggregate supply shocks from 2020Q1 onward are all negative or stagflationary, pushing up inflation and lowering growth. They are generally small, except in 2022Q1-Q2, when they are around -2.8 standard deviations (below mean). These shocks are thus very large.
The aggregate demand shock is negative and huge (-7 standard deviations) in 2020Q2 but subsequently positive every quarter until the end of 2021.
Taken together, the estimated shocks suggests that inflation was pushed up until the first half of 2022 by a combination of positive shocks to aggregate demand and contractionary shocks to aggregate supply.

Source: my estimates as described in the text
Decomposing growth and inflation
The data on real GDP growth and inflation can be decomposed in three components: a deterministic trend and the parts due to the two shocks. The graphs below show the decomposition of growth and inflation relative to the trend. To be clear, the sum of the two components equals the deviation of growth and inflation from the deterministic trend.
Source: my estimates as described in the text
Not surprisingly, the cause of the fluctuations in real GDP growth in 2020Q2-Q3 is due to the collapse and recovery of aggregate demand in that year. Since these are by far the largest swings in real GDP growth, little more can be deduced from graph.
Turning to inflation, the collapse of aggregate demand in 2020Q2 depresses inflation until the end of that year. Subsequently, the aggregate demand factor boosts inflation until 2022Q3. The aggregate supply shock raises inflation through this period, with the effect being particularly large in first half of 2022.

Source: my estimates as described in the text
The relative importance of aggregate supply and demand shocks
The graph above is suggestive of the relative importance of the two shocks. This issue can be assessed formally for the full sample period since, by construction, the two shocks are uncorrelated in the full sample. The graph below shows the variance decomposition for a forecast horizon of 8 quarters. This suggests that while fluctuations in real GDP growth are largely due to aggregate demand shocks, aggregate supply shocks have been marginally more important than aggregate demand shocks in driving inflation.

Source: my estimates as described in the text
Unfortunately, it is not possible to determine with precision the relative importance of aggregate supply and demand shocks for the covid period since they are correlated.
But computing the correlations between the two aggregate shocks and the quarterly growth rates of real GDP and prices for this subperiod is helpful. The graph below shows that the correlation between the aggregate demand shocks and real GDP growth is very high, 0.97. As already shown, this is because the collapse in, and subsequent recovery of, real GDP growth in 2020 is attributed to dramatic swings in aggregate demand. The correlation with growth is much smaller 0.15.
The correlation between the aggregate demand shocks and inflation is 0.48 and a little higher in absolute value than the correlation between the aggregate supply shock and inflation, which is -0.41 (it is negative since an aggregate supply shock by definition raises GDP growth and lowers inflation.) By these estimates, the two shocks appear to have been roughly as important in accounting for movements in inflation during the covid period.

Source: my estimates as described in the text
Conclusions
The analysis above suggests that while aggregate demand and supply factors were roughly as important in driving inflation since 2020, aggregate demand was particularly important in 2020Q2 and 2021Q2-2022Q2 and aggregate supply pushed up inflation consistently between 2020Q2 and 2023Q1. The disinflation during the last five quarters appears due to a normalisation of supply factors.
Could you share your analysis' code?