

What does US labour market data tell us about the Fed decision?
2024-20


Quite a bit of US labour market data were released last week. Given Chairman Powell’s speech at the Jackson Hole conference (which I wrote about earlier), it makes sense to look at them carefully. Here I first review the most important data, and then I discuss how the data might influence next week’s Fed decision.
The JOLTS data
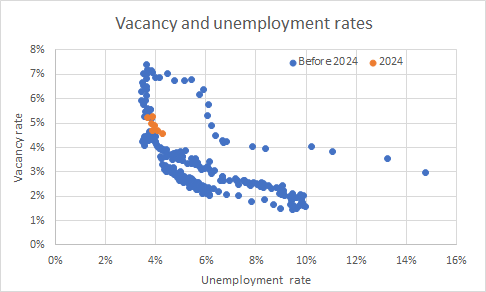
To me, the most interesting JOLTS data are the vacancy rates. They appear together with the unemployment rate in the Beveridge curve and the vacancy/unemployment ratio, v/u, is a powerful driver of inflation.
The graph below shows the Beveridge curve using data from January 2001 to July 2024, when the vacancy rate was 4.6% and the unemployment rate 4.3% (the latter fell to 4.2% in August).
For comparison, the average vacancy and unemployment rates in this period were 3.5% and 5.8% respectively. This suggests that the labour market still has a little distance to go before it has returned to normality. Given that the Beveridge curve looks like a rectangular hyperbola, going forward that adjustment will involve larger increases in the unemployment rate and smaller declines in the vacancy rate.
Source: BLS
The Employment Report
Turning to the Employment report, the unemployment rate has been gradually rising since reaching a low of 3.4% in January 2023. However, and as noted above, it declined from July to August and 4.2% is a low level in a historical perspective.

Source: BLS
The non-farm payrolls data released on Friday last week attracted considerable attention, principally because at 142k it was a little less than the expected 165k. However, these data are notoriously erratic, as illustrated by the July data being revised down by 86k to 89k. Indeed, the BLS states that a 90% confidence band is 142k ±130k or 12k to 272k. Thus, one month of payroll data is not very informative.
Computing the growth rate over 12 months of the payroll data shows that employment growth is continuing to slow gradually. Thus, the labour market is continuing to adjust.
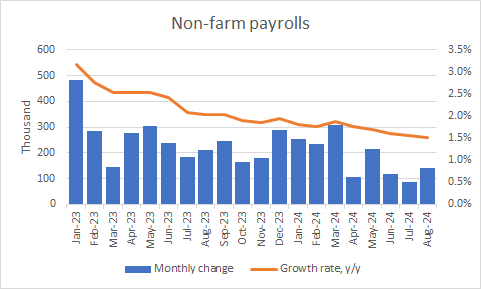
Source: BLS
Further evidence that US labour is slowing is apparent by looking at data on permanent job losers and long-term unemployed, both of which have been gradually rising over the last 18 months.

Source: BLS
Data on the employment-population ratio also suggests that the labour market is gradually cooling. However, the participation ration has been rising a little over the last year and a half.
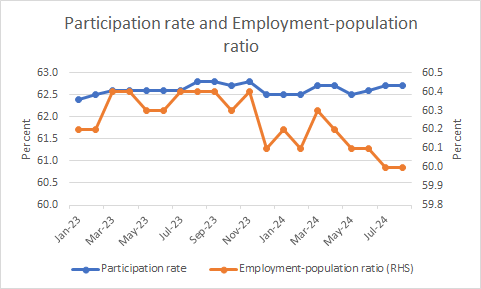
Source: BLS
Finally, looking at the annual growth rate of hourly earnings also suggest that the labour market is slowing.

Source: BLS
What will the Fed make of these data?
The key question is what the Federal Reserve will think of these data. In my view, they show that the labour market is weakening, but not collapsing, and that the normalisation process has a little further to run. Since inflation in the US has been particularly rapid in the labour-intensive service sector, the Federal Reserve has welcomed labour markets becoming a little less tight.
But with monetary policy impacting on the economy with a long delay, the FOMC needs to cut interest rates well before the labour market has fully normalised. September is a good time to start that process, which will involve a number of cuts: financial markets are pricing in 250 bps of interest rate reductions between now and September 2025.
Should it cut interest rates by 0.25% or 0.50%? Different FOMC members will interpret these data in different ways. The CPI data for August will be published on 11 September and the FOMC will look at them closely. Unless they show that inflation is weaker than expected, I believe that the Fed will cut interest rates by 0.25% (in particular since a large interest rate cut just before an election may put the political spotlight on the Fed).
If this turns out to be too little, it can take larger steps in the November and December meetings. The exact speed by which the Fed lowers rates is of little importance – it doesn’t matter much for the economy if it cuts by 25 bps too much or little six weeks early or late since it can compensate later. Of course, individual interest rate decisions can matter hugely for financial markets, but the Fed will not be overly concerned about them.
Excellent summary and analysis, Stefan. Marking different periods on the Beveridge curve (e.g. pre-, during and post Covid) as well as 2024 might also be interesting (as it would show vertical shifts. Paul